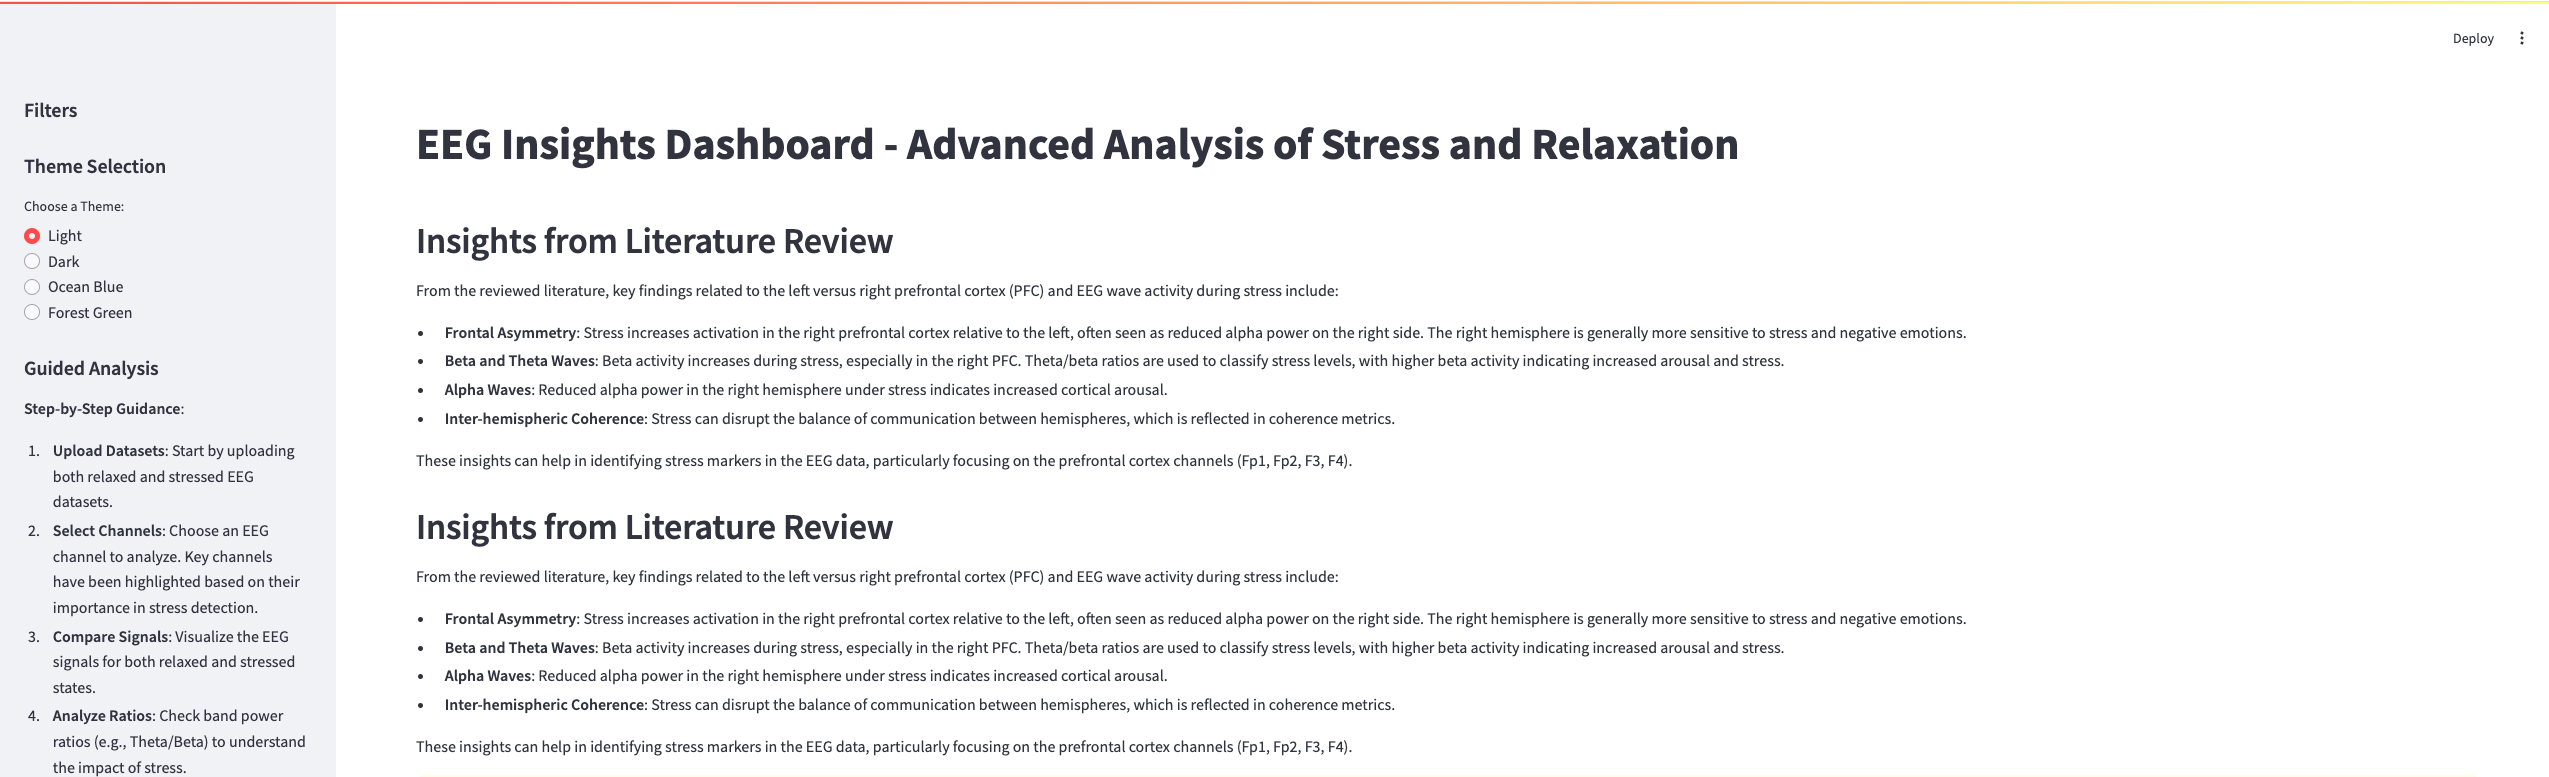
EEG Insights Dashboard
A tool for analyzing stress and relaxation using EEG data.
Project Overview
This interactive dashboard enables users to analyze EEG data, leveraging bandpass filters, power spectral density (PSD) computations, and statistical tests to understand the impact of stress and relaxation on the brain. Key features include data visualization, band power ratio analysis, and channel comparisons.
Why It Matters
EEG analysis provides crucial insights into mental health and cognitive states. By identifying stress markers and patterns, this tool contributes to advancements in neuroscience, mental health diagnostics, and performance optimization.
Key Features
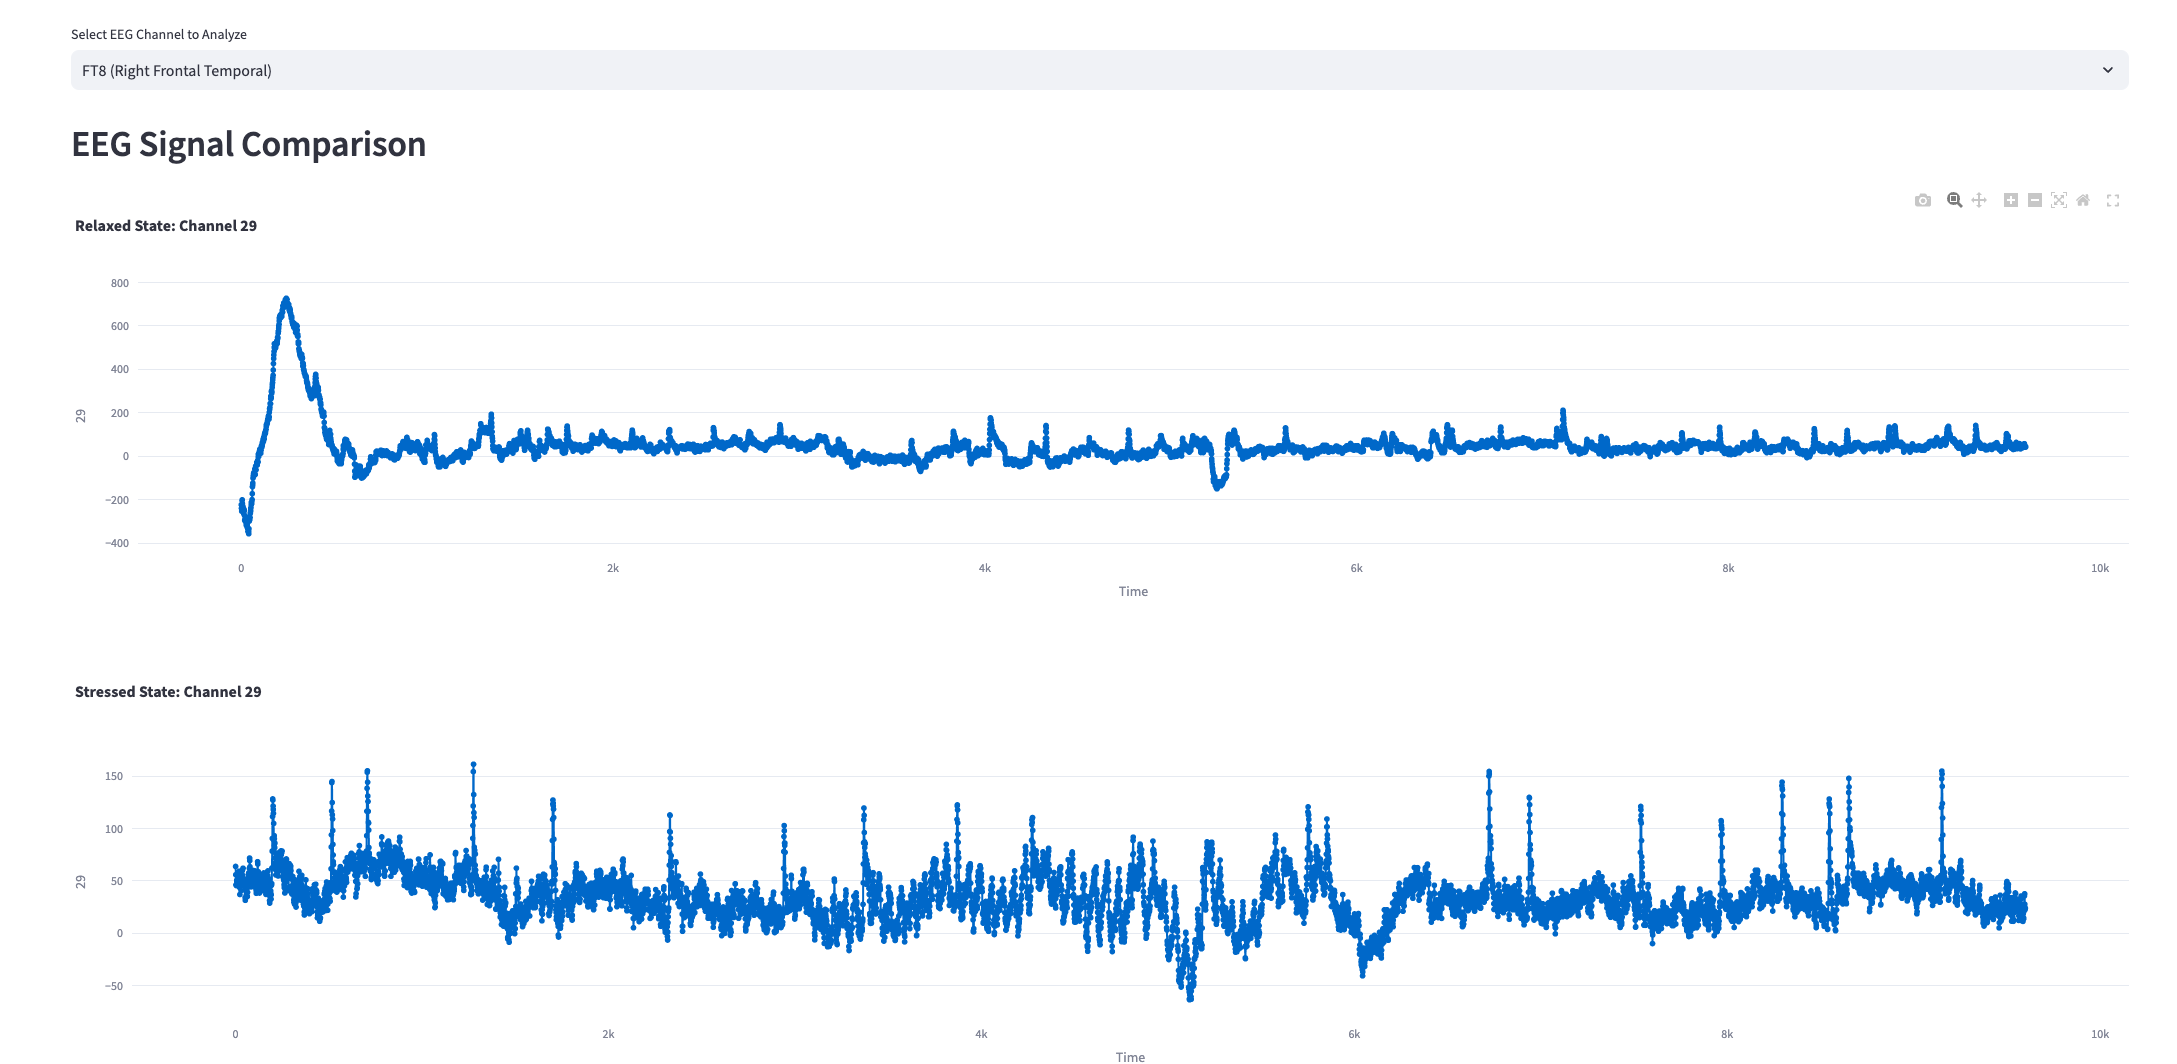
- Interactive visualization of EEG signals for stressed and relaxed states.
- Computation of band power ratios (e.g., Theta/Beta, Beta/Alpha) for stress analysis.
- Statistical testing to identify significant differences between states.
- Correlation heatmaps and channel comparisons for in-depth analysis.
Project Screenshots
EEG Signal Visualization
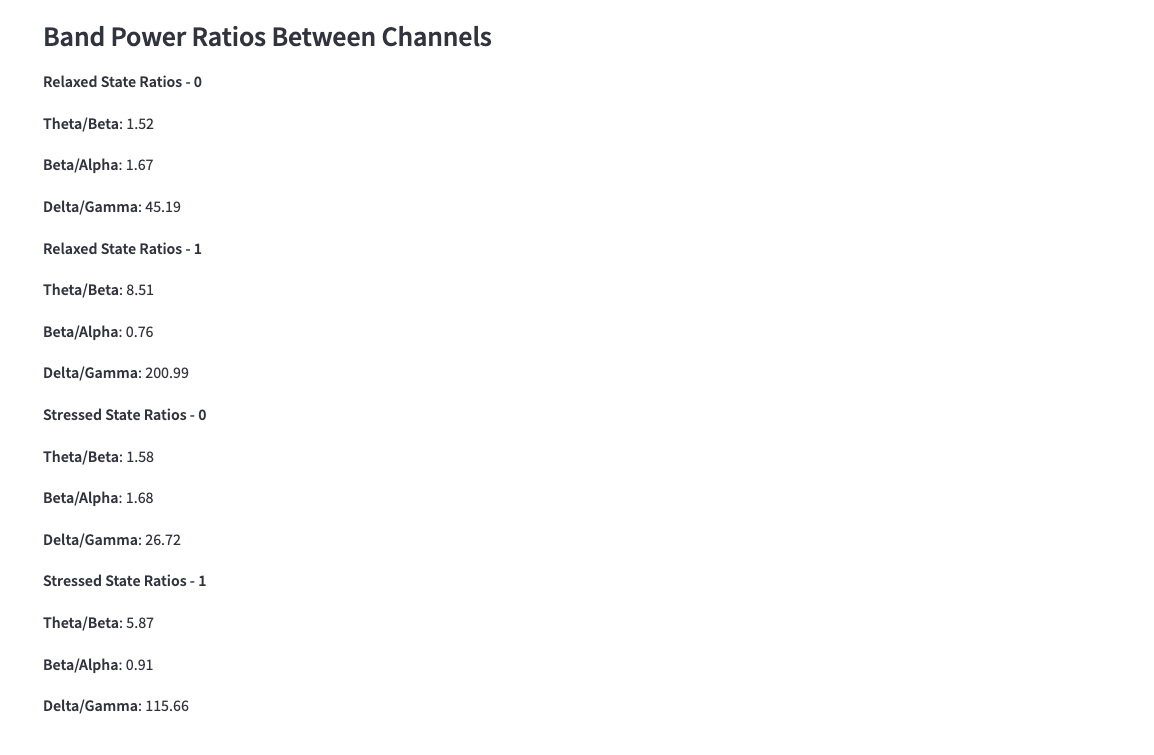
Band Power Ratio Analysis
Channel Comparison
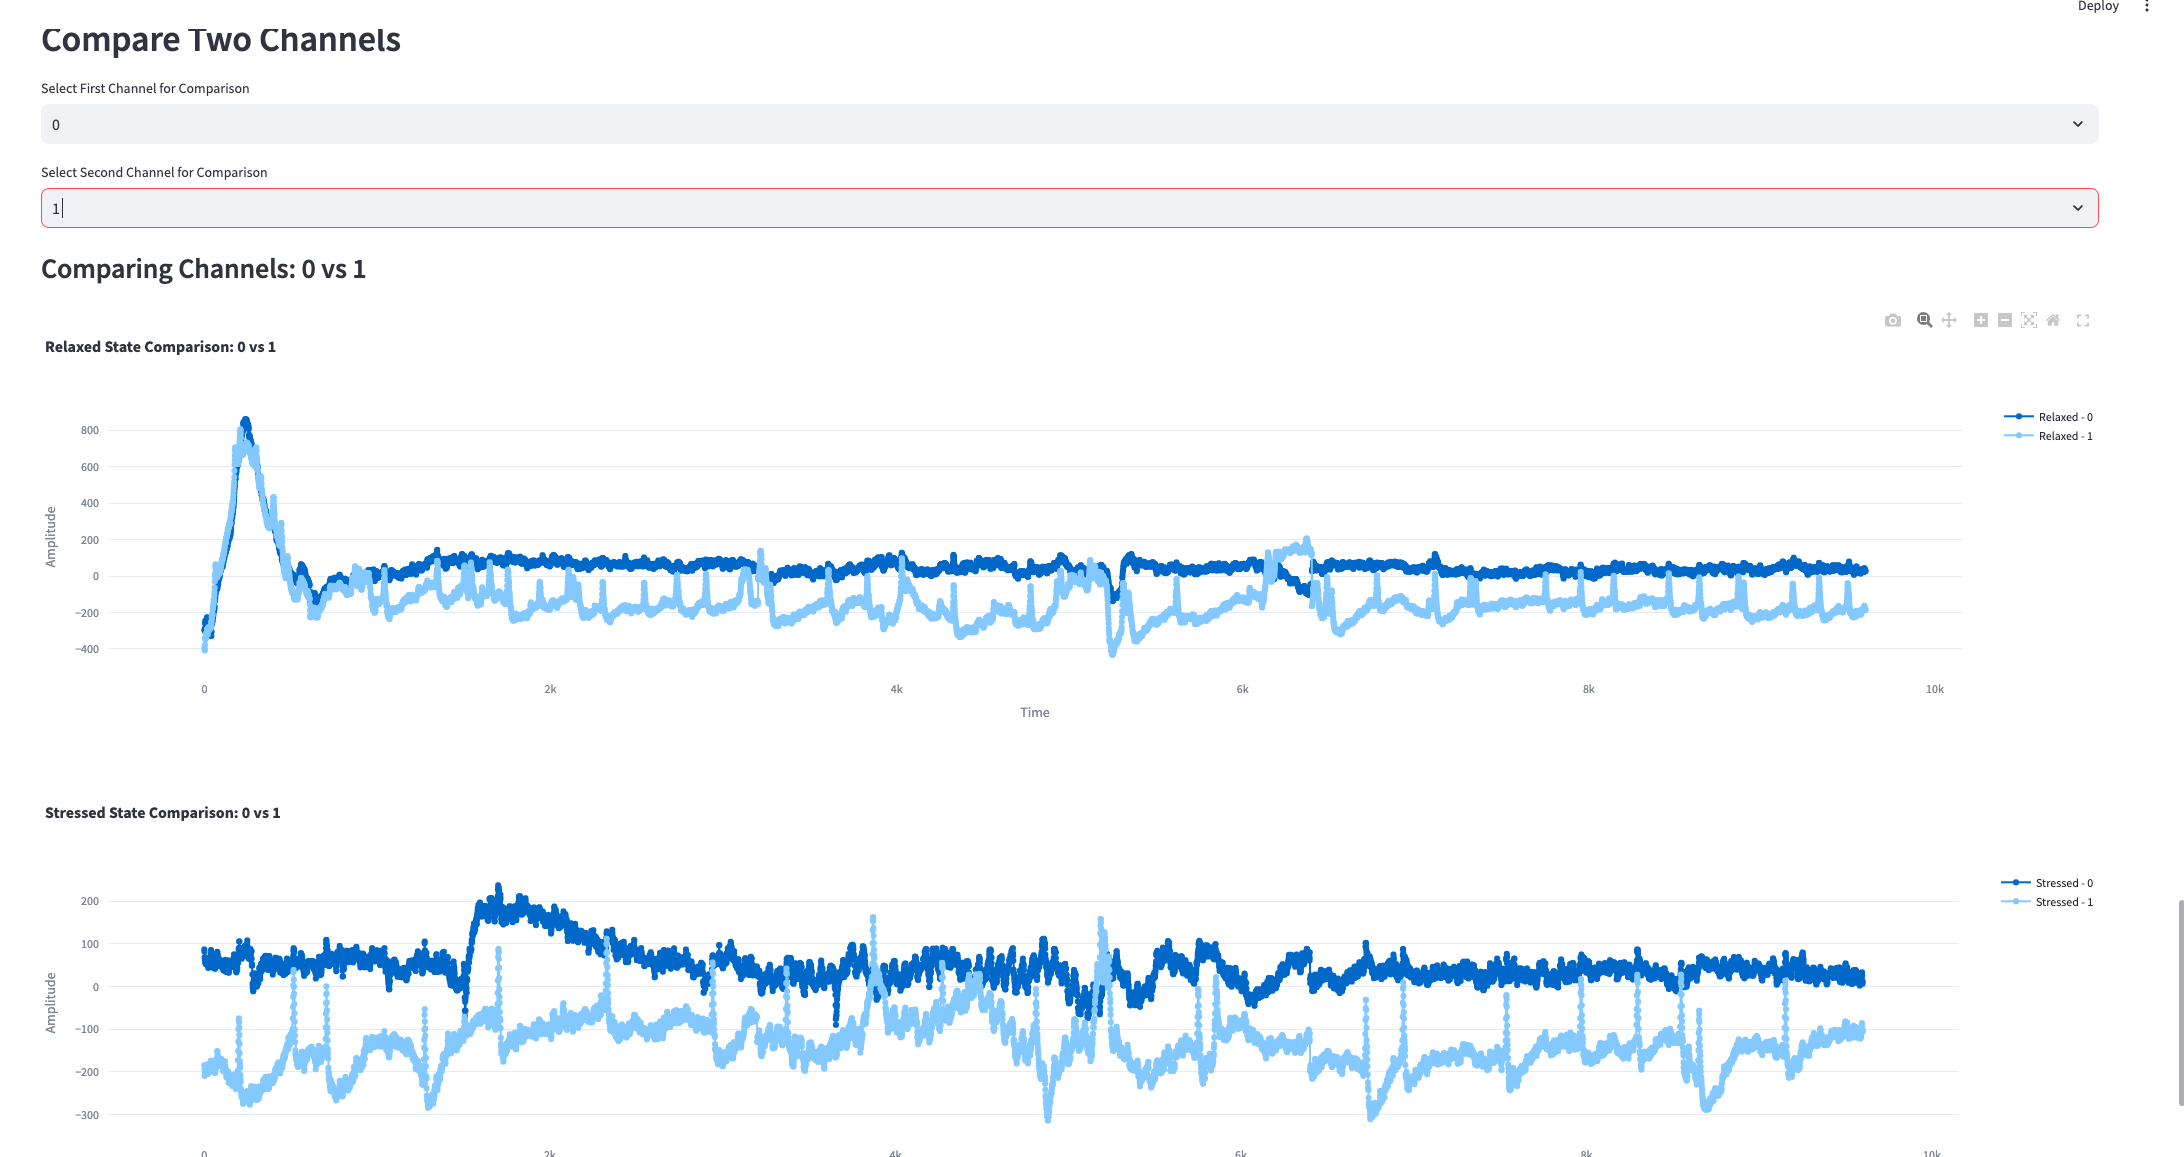
Stress vs Relaxed State Comparison
Learn More
Discover the science behind EEG analysis with these resources: